Client reports
Client reports turn your delivery history into a clean, shareable summary: how many contacts synced, how reliably they landed in each email tool, and which sync rules did the work. They are built for handing a client (or your own stakeholders) a straight answer to "is this working?"
Reports are a Pro and Agency feature. On Free and Growth the Reports tab is not available. Everything a report counts already exists in your event log; a report just rolls it up by period, tool, and rule.
Tip: A report measures deliveries QuillJet made into your email tool. It does not measure opens, clicks, or anything your email tool does after the contact arrives. QuillJet syncs contacts; your email tool owns sending.
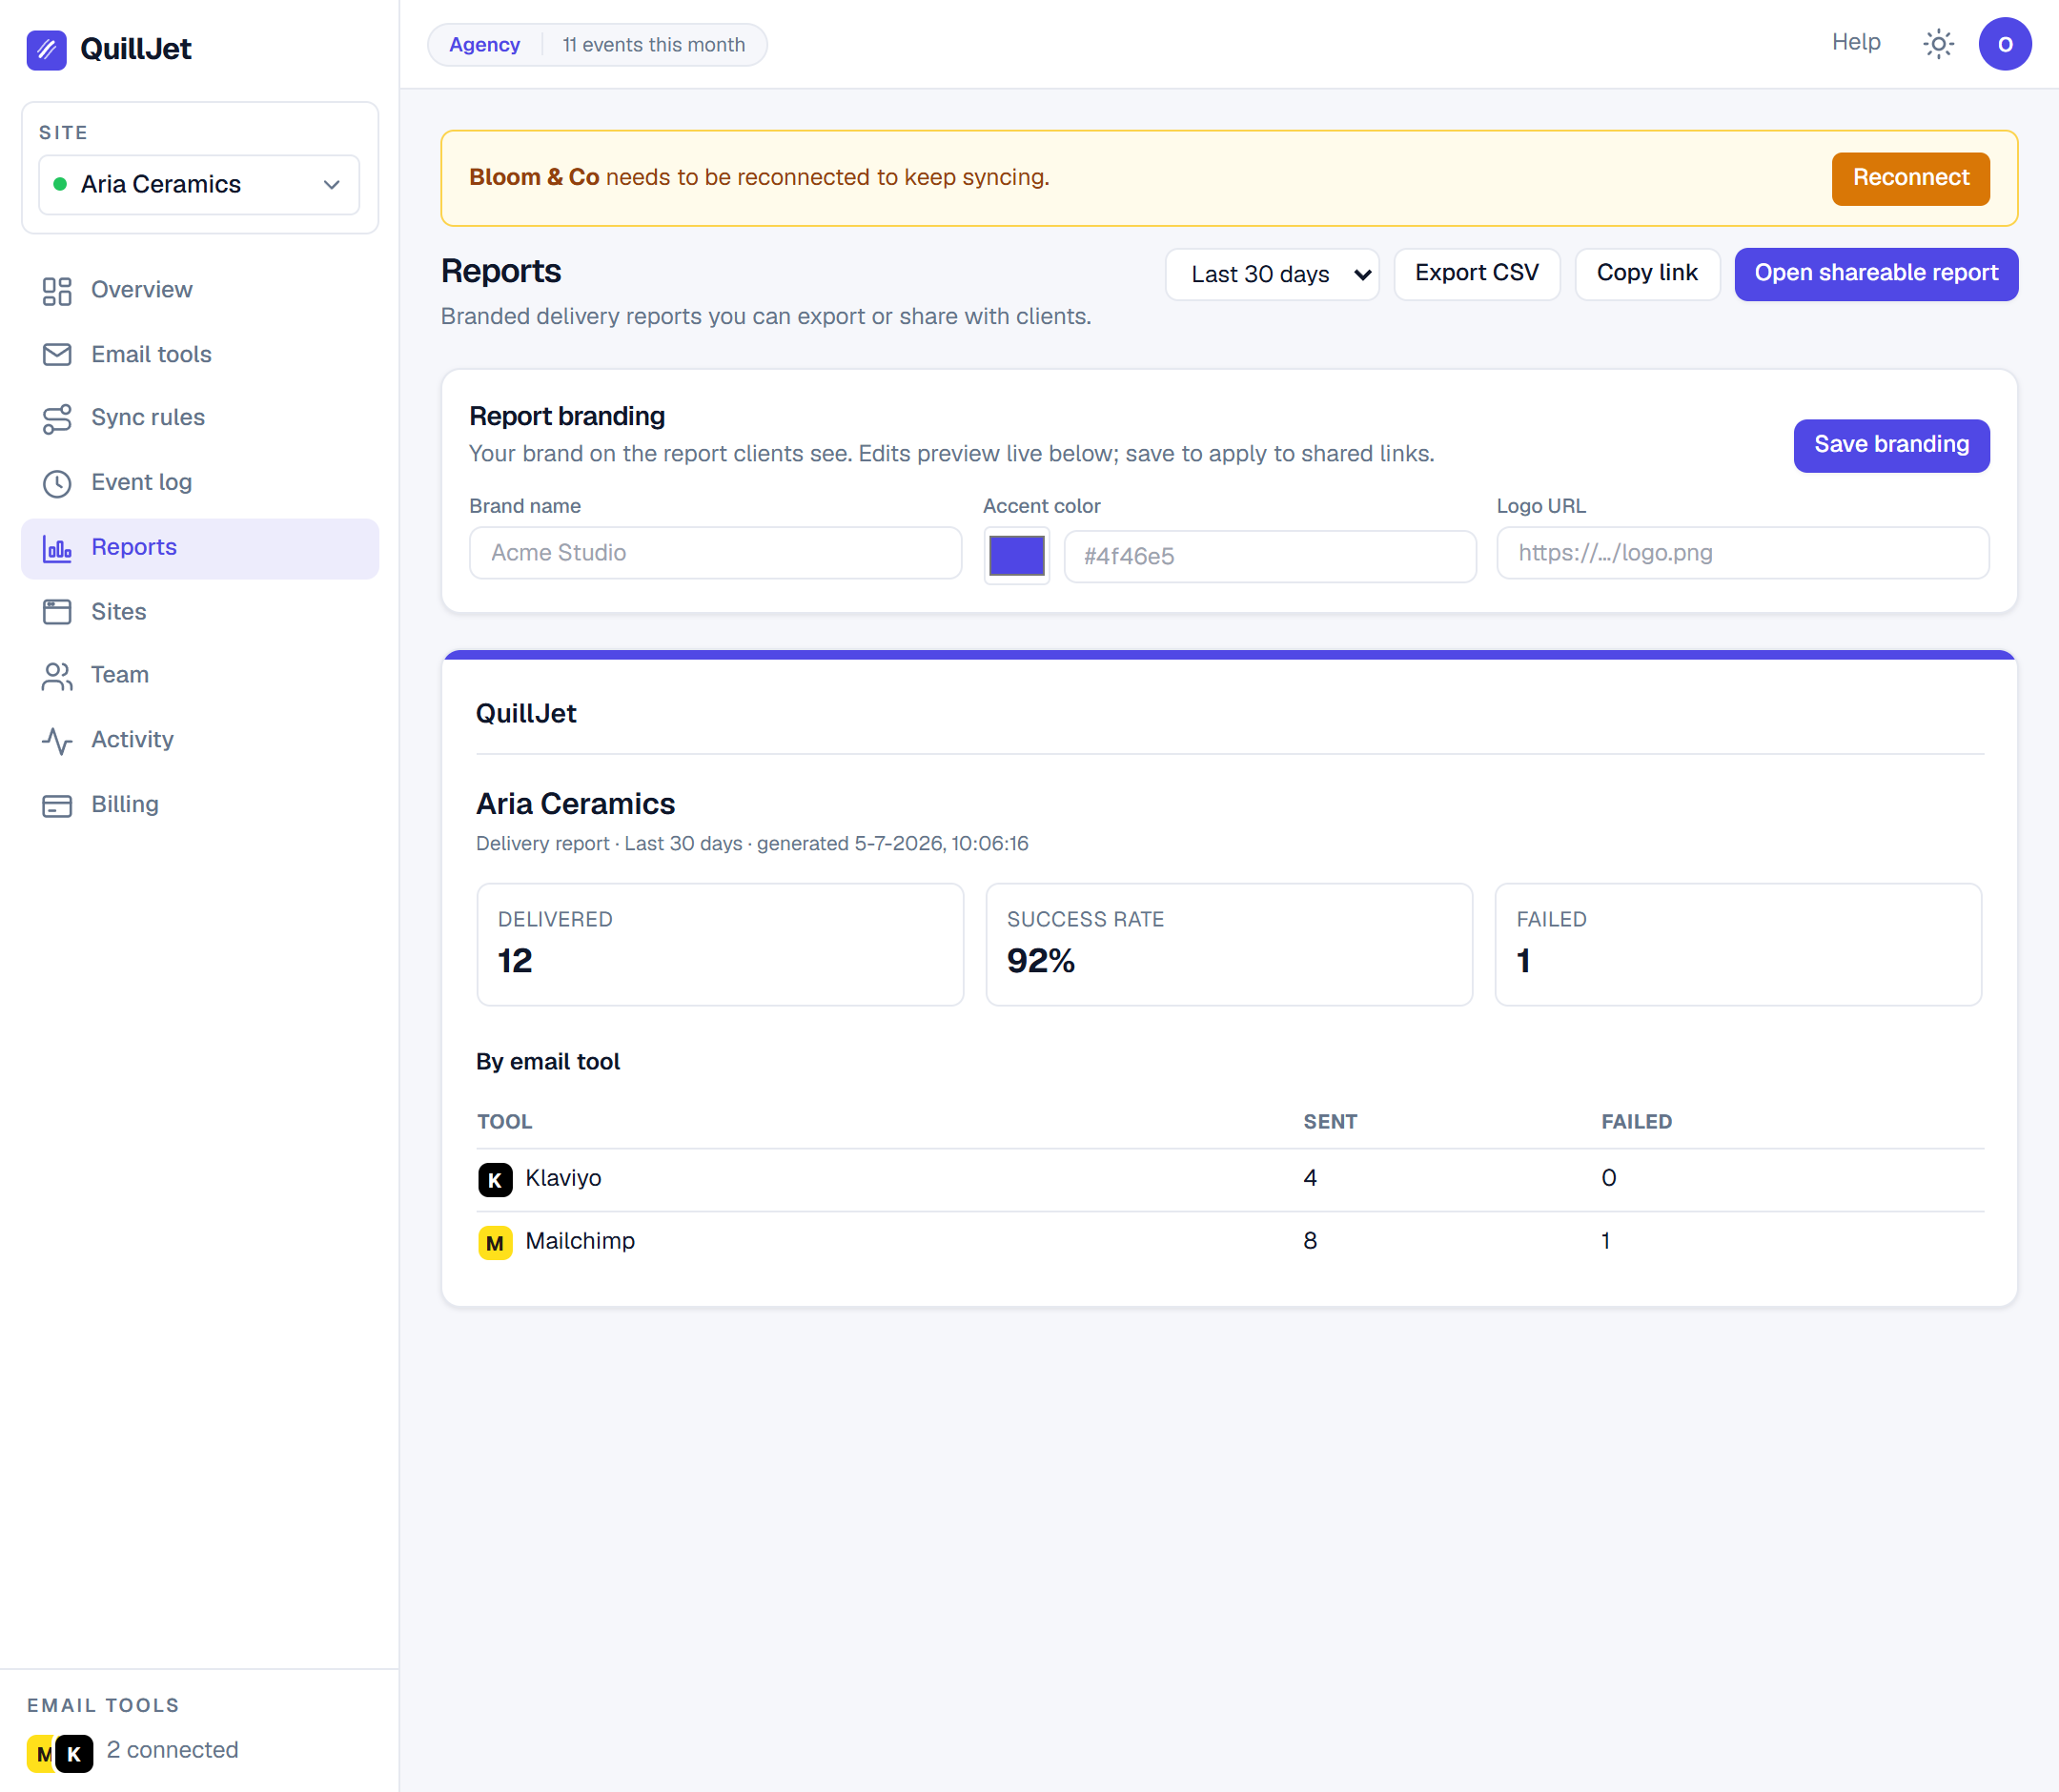
What a report shows (totals, success rate, by tool, by rule, per-day, period 7/30/90d)
Pick a period at the top: 7, 30, or 90 days. The report then shows, for that window:
- Totals: how many deliveries were sent and how many failed.
- Success rate: sent divided by (sent plus failed), as a whole percentage. Skipped deliveries (a condition was not met) are not counted against your success rate, because nothing was supposed to sync. When there are no sent or failed deliveries in the period, the success rate shows as not available rather than zero.
- By email tool: sent and failed counts broken down per connected tool (Mailchimp, Klaviyo, Brevo, and so on), so you can see if one connection is misbehaving.
- By rule: which sync rules produced the deliveries.
- Per-day: a day-by-day breakdown of sent and failed, so a bad afternoon is easy to spot.
Counts come straight from your delivery records, so a report always matches what you see if you open the individual events.
Per-site and all-sites
Reports are built per site. Choose the site you want and the report covers only that site's events and deliveries. If you manage several client sites, run one report per site so each client sees only their own numbers. You can move between your sites from the Sites selector and pull a fresh report for each.
Shareable read-only links
Every report comes with a read-only public link you can forward to a client. The link opens a standalone, branded page with the same totals, success rate, and by-tool breakdown, and it needs no login.
- The link is signed, so only the exact report it was generated for will open.
- It is read-only. A client can view the numbers but cannot see your account, other sites, or any contact data.
- The page reflects the period you selected when the link was generated.
CSV export and printing
The public report page is a clean, self-contained page, so you can print it (or save it as a PDF) straight from your browser for a monthly recap. Report data is also available as CSV on Pro and Agency, so you can drop the numbers into a spreadsheet or your own client deck.
White-label (Agency)
White-label reports are an Agency-only feature. With white-label on, the shareable report page carries your own brand instead of QuillJet's:
- Brand name in place of QuillJet.
- Accent color applied to the report's highlights.
- Your logo at the top of the page.
When branding is set, the "Powered by QuillJet" line is removed from the shared page, so a client sees your agency, not ours. Set your brand name, accent color, and logo in your account settings. On Pro (without white-label) the shared page uses the default QuillJet look.
Where to next
- Confirm what each delivery status means in how syncing works.
- Chase down a specific failed or skipped delivery in troubleshooting.
- Compare plan limits and the reports and white-label tiers in billing and plans.